
Key Takeaways
- Bitcoin is stuck between $21,500 and $21,000.
- Meanwhile, Ethereum is trading between $1,250 and $1,190.
- Closing outside these trading ranges will determine the trend’s direction.
Bitcoin and Ethereum prices have been relatively stable over the past few days, as traders remain undecided on which direction prices will go next. However, with market volatility remaining high, it is only a matter of time before Bitcoin and Ethereum see some big price movements.
Bitcoin and Ethereum Primed for Volatility
Bitcoin and Ethereum remained stagnant over the weekend, but a few indicators suggest that volatility is about to resume.
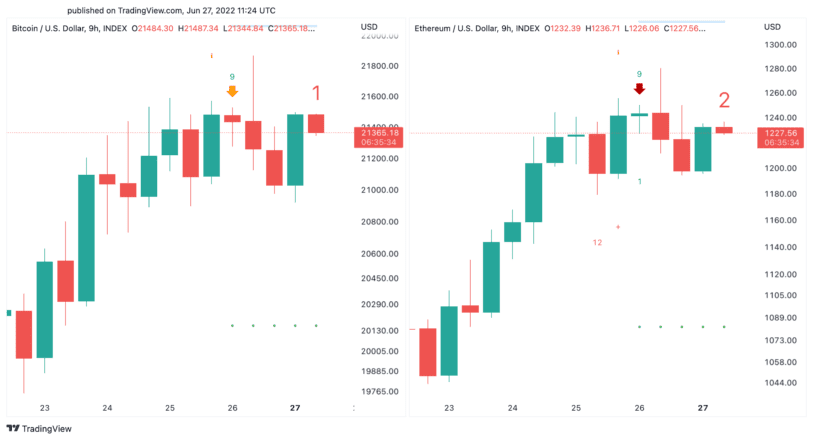
BTC is stuck in a tight price range between $21,500 and $21,000 while ETH continues to trade between $1,250 and $1,190. Both cryptocurrencies have seen their prices squeeze in the last few days as the market sentiment remains in “extreme fear.” Interestingly, a particular technical indicator hints at the probability of a downswing.
The Tom DeMark (TD) Sequential indicator recently presented sell signals on Bitcoin and Ethereum’s nine-hour chart. The bearish formations developed as green nine candlesticks, indicative of one to four candlesticks correction. Although BTC and ETH took a brief nosedive after the technical development, there hasn’t been a clear violation of support or resistance.
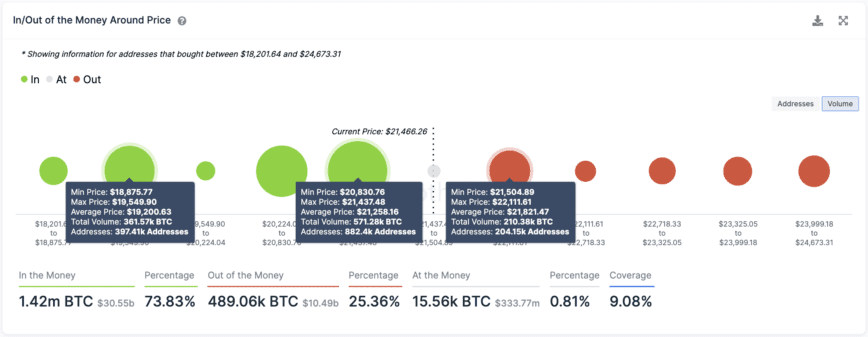
Transaction history shows two critical price points that may help determine where Bitcoin is going next. Roughly 882,400 addresses had previously purchased over 570,000 BTC between $20,800 and $21,500. Meanwhile, more than 200,000 addresses are holding over 210,000 BTC $21,500 and $22,100.
Given the lack of resistance ahead, a sustained nine-hour candlestick close above $22,100 could be significant enough to trigger a bullish breakout toward $25,000 or even $27,000. But if the $20,800 support level were to give up, the next crucial interest zone sits at $19,000.
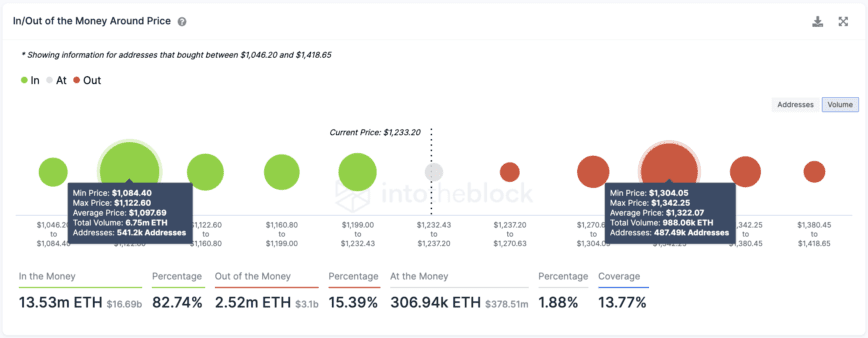
Transaction history also reveals that Ethereum cannot afford to lose the $1,100 support level. Breaching such a vital demand zone can trigger another sell-off that sends ETH to $600. Therefore, it’s imperative for Ether to slice through the $1,320 resistance barrier to have a chance of advancing toward $1,700.
The macroeconomic outlook still doesn’t look favorable as recession fears heighten. For this reason, it’s imperative to wait for a decisive close below resistance or above support to enter the markets. Although a few metrics suggest that the bottom is near, there could be more downward movement before the trend reverses.
Disclosure: At the time of writing, the author of this piece owned BTC and ETH.